 2. Genome View
 How to use Delta?
2. Genome View
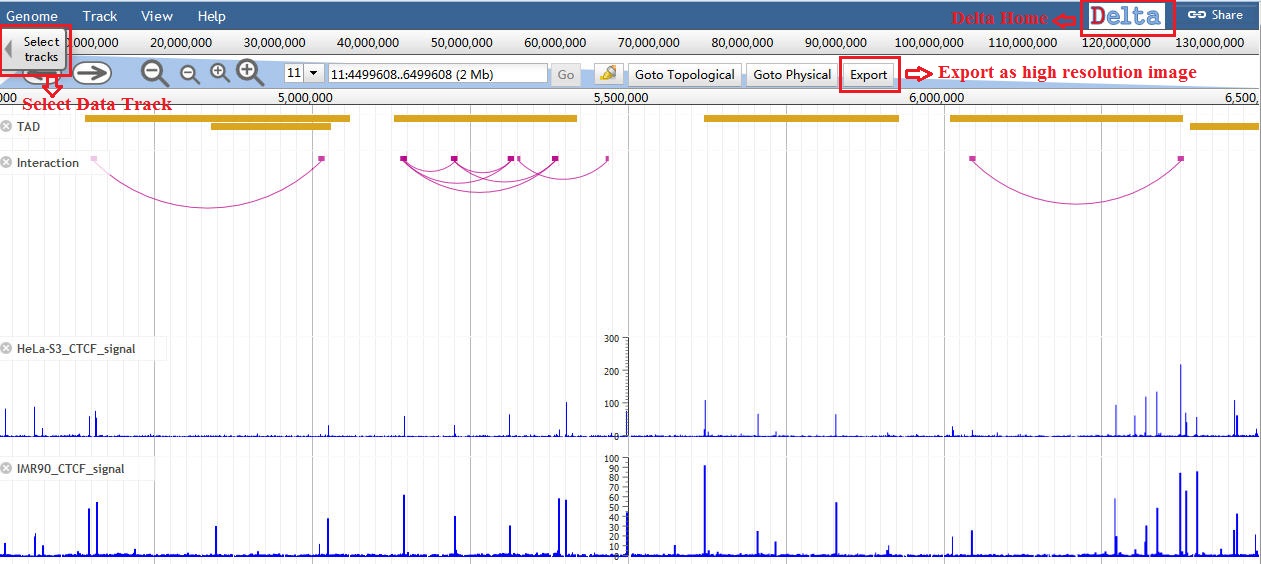
Delta uses JBrowse to show 3D genome features and other omics data,such as Ensembl annotations and ENCODE data
Delta uses different glyphs to represent different features. It represents Matrix as a triangle heatmap, TAD as a rectangle as well as interaction peak as an arc line. Users can pan left or right, zoom in or out, toggle tracks on or off in the Genome View. And they can also export the whole web page as a high resolution image.
Delta uses different glyphs to represent different features. It represents Matrix as a triangle heatmap, TAD as a rectangle as well as interaction peak as an arc line. Users can pan left or right, zoom in or out, toggle tracks on or off in the Genome View. And they can also export the whole web page as a high resolution image.
2.1 Add custom tracks
Users can click the "Track"->"Open track file or URL" menu to upload own data and a dialog as follows will be shown. After upload the file, users need to set the file format from “Files and URLS” and set the display glyph from "New Tracks".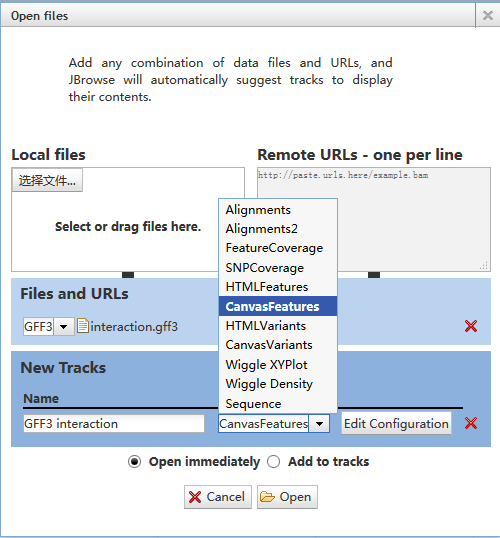
Note: One should choose HTMLFeatures for most of data;
choose CanvasFeatures for loop;
choose Wiggle XYPlot for BigWig file.
For more features, you can check JBrowse help page.
2.2 Jumping to Topological View and Physical View
Users can click the "Goto Topological" or "Goto Physical" button to go to the Topological View or Physical View respectively.
2.3 Export Genome View
Users can export the shown tracks in Genome View by clicking "export" button. Delta uses a PhantomJS tool to create the export image. When you found the exported image is not complete, you need to refresh the export web page to load the full image.