 4. Physical View
 4.Physical View
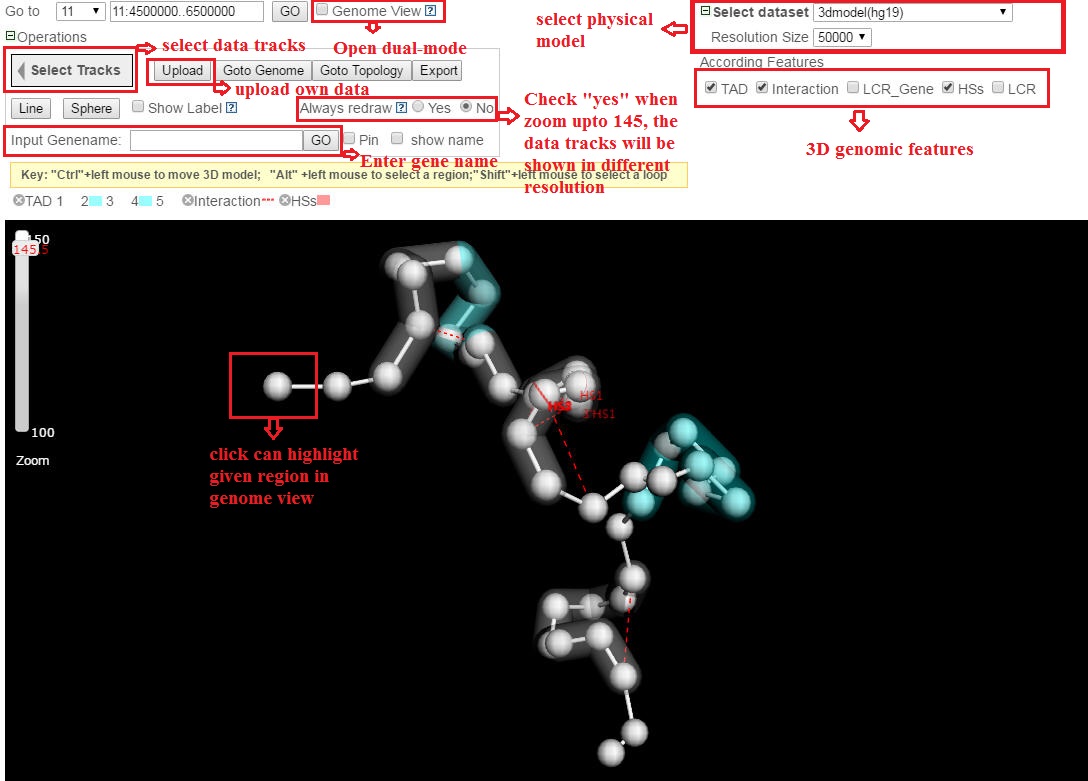
4.1 Add custom tracks
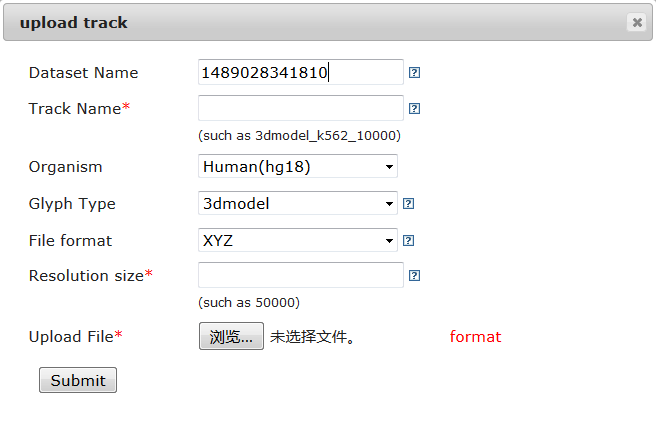
To add a custom track, users can click on “Upload”, a web page will be shown like the following:
1) The 3D model file format
Delta accepts XYZ and JSON format for 3D model.
Example
4
xyz
C 0.00 0.00 0.00 1:1..1000000
C 0.00 1.00 0.00 1:1000000..2000000
C 0.00 1.00 1.00 1:2000000..3000000
C 0.00 0.00 1.00 1:3000000..4000000
Example
A JSON file
[{"name":"C1","chr":"1","start":1,"end":10000,"x":0.0000,"y":0.0000,"z":0.0000},{"name":"C2","chr":"1","start":10001,"end":20000,"x":0.2123,"y":0.0000,"z":0.0000},{"name":"C3","chr":"1","start":20001,"end":30000,"x":0.1291,"y":0.1493,"z":0.0000}]
Example
4
xyz
C 0.00 0.00 0.00 1:1..1000000
C 0.00 1.00 0.00 1:1000000..2000000
C 0.00 1.00 1.00 1:2000000..3000000
C 0.00 0.00 1.00 1:3000000..4000000
Example
A JSON file
[{"name":"C1","chr":"1","start":1,"end":10000,"x":0.0000,"y":0.0000,"z":0.0000},{"name":"C2","chr":"1","start":10001,"end":20000,"x":0.2123,"y":0.0000,"z":0.0000},{"name":"C3","chr":"1","start":20001,"end":30000,"x":0.1291,"y":0.1493,"z":0.0000}]
2) The GFF3 format for Gene
11 ensembl protein_coding 4072500 4116681 . + . ID=RRM1;Name=RRM1
11 ensembl protein_coding 4219862 4220446 . - . ID=AC018793.12-1;Name=AC018793.12-1
11 ensembl protein_coding 4307671 4308255 . + . ID=AC018793.12-2;Name=AC018793.12-2
11 ensembl protein_coding 4345157 4346101 . - . ID=OR52B4;Name=OR52B4
11 ensembl protein_coding 4219862 4220446 . - . ID=AC018793.12-1;Name=AC018793.12-1
11 ensembl protein_coding 4307671 4308255 . + . ID=AC018793.12-2;Name=AC018793.12-2
11 ensembl protein_coding 4345157 4346101 . - . ID=OR52B4;Name=OR52B4
3) The GFF3 format for annotated feature
11 encode histone 4449556 4452889 1.7674419 . . ID=1336;Name=1336;Min=0.0;Max=37
11 encode histone 4452889 4456222 2.409863 . . ID=1337;Name=1337;Min=0.0;Max=37
11 encode histone 4456222 4459555 1.3539394 . . ID=1338;Name=1338;Min=0.0;Max=37
11 encode histone 4459555 4462888 1.435 . . ID=1339;Name=1339;Min=0.0;Max=37
11 encode histone 4462888 4466221 1.3724136 . . ID=1340;Name=1340;Min=0.0;Max=37
4) The GFF3 format for Interaction
11 hic arc 4600000 5050000 . . . ID=87;Name=87;Note=11:4600000-4650000|11:5000000-5050000
11 hic arc 4600000 5100000 . . . ID=88;Name=88;Note=11:4600000-4650000|11:5050000-5100000
11 hic arc 4600000 5150000 . . . ID=89;Name=89;Note=11:4600000-4650000|11:5100000-5150000
11 hic arc 4600000 5100000 . . . ID=88;Name=88;Note=11:4600000-4650000|11:5050000-5100000
11 hic arc 4600000 5150000 . . . ID=89;Name=89;Note=11:4600000-4650000|11:5100000-5150000
5) The GFF3 format for TAD
11 hic tad 4500000 4650000 . . . ID=1;Name=1;
11 hic tad 5300000 5450000 . . ID=2;Name=2;
11 hic tad 5450000 5650000 . . . ID=3;Name=3;
11 hic tad 6200000 6400000 . . . ID=4;Name=4;
11 hic tad 5300000 5450000 . . ID=2;Name=2;
11 hic tad 5450000 5650000 . . . ID=3;Name=3;
11 hic tad 6200000 6400000 . . . ID=4;Name=4;
4.2 Annotating 3D model
Four types of tracks (quantitative, regional, labeling, and connective) are currently supported.
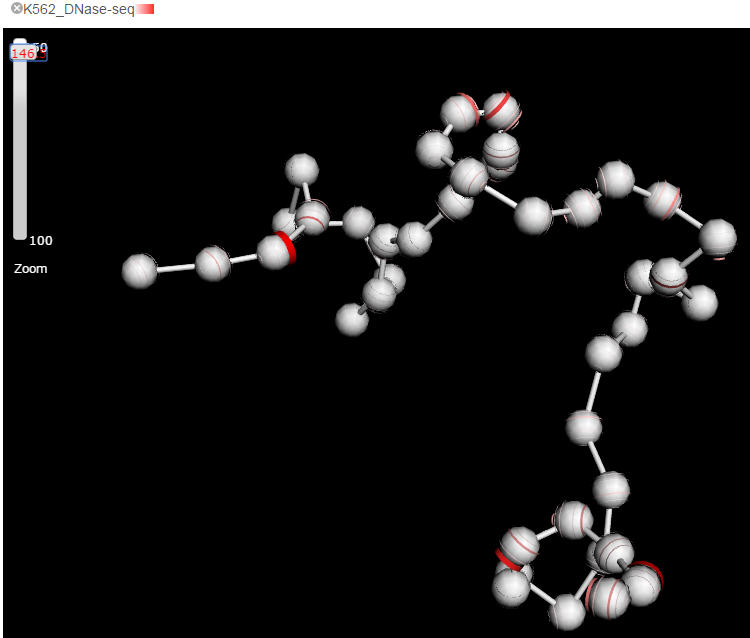
The quantitative feature, as the major category of features that covers the output of a wide spectrum of biochemical assays, e.g. ChIP-seq, DNase-seq, RNA-seq, is represented as a colored stripe on the beads. The brightness and width of the stripe represents the strength of the feature. Delta can automatically determine to display summarized data or raw data points according to the current zooming level. For example, when the mode is fully zoomed out, the mean value of the feature within the genome region of a bead is painted onto the whole bead, while zooming in, more and more detailed features will emerge. Ideally, i.e the model was built with sufficient small bin size, each annotated ChIP-seq peaks shall be presented when zoom into the highest resolution. However, because the highest resolution 3D physical models that possibly generated from current Hi-C data is about hundreds of kilobases, we only allow maximal 10 bins within a bead for any quantitative features.
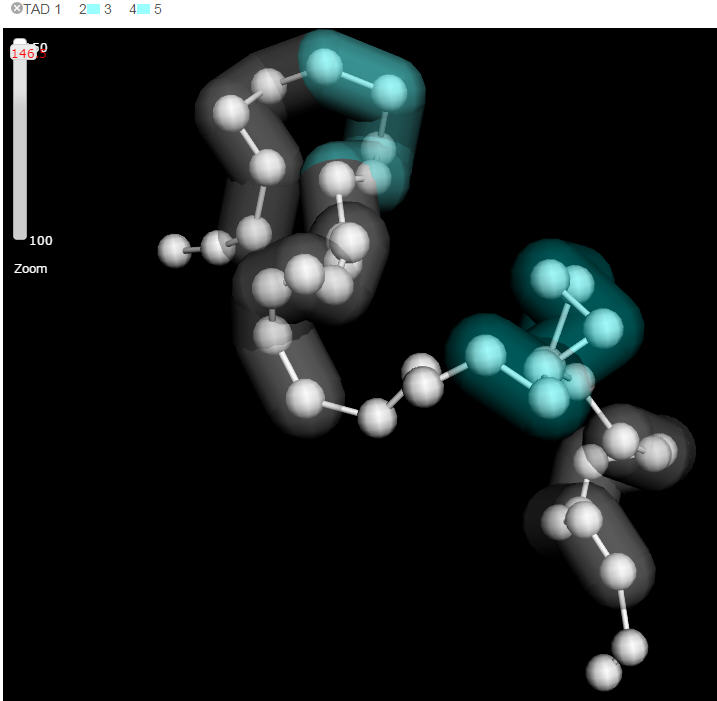
A regional feature is visualized as a colored shadow covering the beads within the domain. The minimal unit in displaying regional feature is a bead, in another word, when a domain cover a region less than a bead represented, the whole bead will be shadowed. If there are more than two domains need to be shown in the current visual field, Delta will shadow the domains with two alternating colors. Users can upload their customized domain data as well.
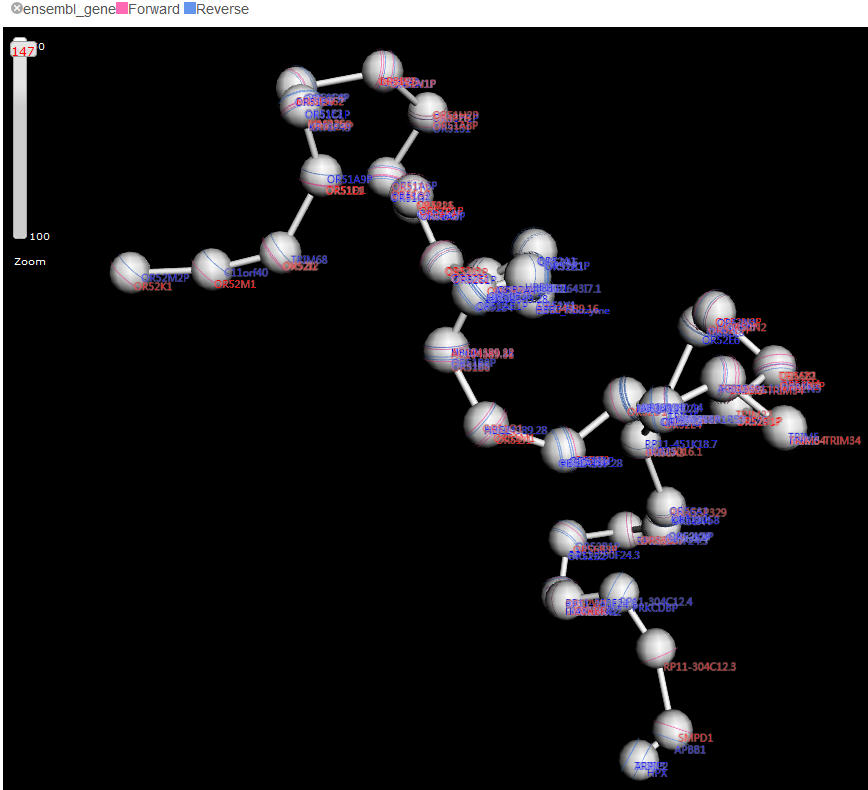
The labeling feature is represented as plain text marked next to the genomic features. The most commonly used labeling feature is gene name. Although having all genes labelled is supported, it is not recommended as the labels will be overlapping with each other and can be hardly distinguished. Users can label the selected genes by inputting the names. In fact, Delta takes the gene annotations as both quantitative and labeling features. When the view is extremely zoomed out, Delta will take the genes as quantitative features with brightness of color represents the gene density in the genome region, when the view is sufficiently zoomed in, the gene features will be turned into labeling, in which each gene can be presented as individual stripe with gene name labeled, the orientation of the gene is indicated by the color of stripe.
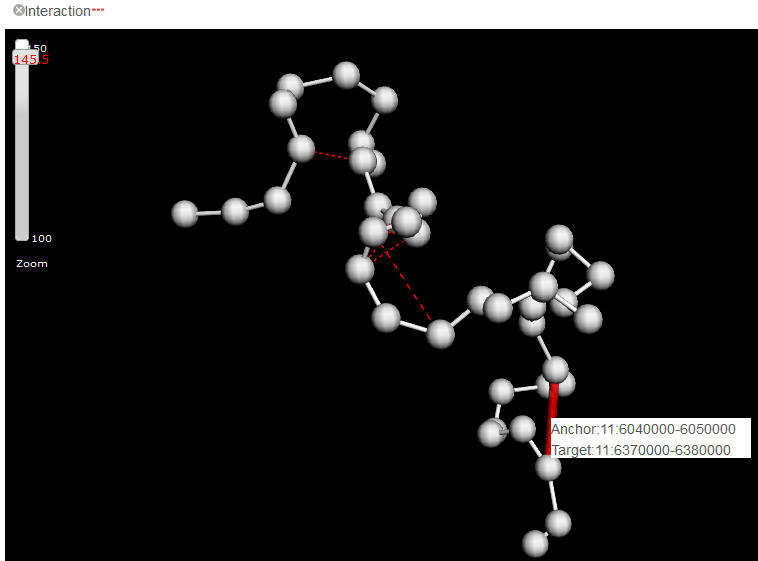
Connective features is the dashed arcs linking two beads, representing the chromatin loops . Delta displays intra-region (visual field) loops, i.e. the loops connecting to the beads out of current visual field will be omitted. This setting can help users focus on the selected partners in a clear vision. The arcs can be highlighted using mouse click with "shift" key down. Highlighting an arc will refresh the conjunct genome/circlet browser (see below). This is rather useful when comparing the two connected loci with multiple epigenetic features.
The quantitative feature, as the major category of features that covers the output of a wide spectrum of biochemical assays, e.g. ChIP-seq, DNase-seq, RNA-seq, is represented as a colored stripe on the beads. The brightness and width of the stripe represents the strength of the feature. Delta can automatically determine to display summarized data or raw data points according to the current zooming level. For example, when the mode is fully zoomed out, the mean value of the feature within the genome region of a bead is painted onto the whole bead, while zooming in, more and more detailed features will emerge. Ideally, i.e the model was built with sufficient small bin size, each annotated ChIP-seq peaks shall be presented when zoom into the highest resolution. However, because the highest resolution 3D physical models that possibly generated from current Hi-C data is about hundreds of kilobases, we only allow maximal 10 bins within a bead for any quantitative features.
A regional feature is visualized as a colored shadow covering the beads within the domain. The minimal unit in displaying regional feature is a bead, in another word, when a domain cover a region less than a bead represented, the whole bead will be shadowed. If there are more than two domains need to be shown in the current visual field, Delta will shadow the domains with two alternating colors. Users can upload their customized domain data as well.
The labeling feature is represented as plain text marked next to the genomic features. The most commonly used labeling feature is gene name. Although having all genes labelled is supported, it is not recommended as the labels will be overlapping with each other and can be hardly distinguished. Users can label the selected genes by inputting the names. In fact, Delta takes the gene annotations as both quantitative and labeling features. When the view is extremely zoomed out, Delta will take the genes as quantitative features with brightness of color represents the gene density in the genome region, when the view is sufficiently zoomed in, the gene features will be turned into labeling, in which each gene can be presented as individual stripe with gene name labeled, the orientation of the gene is indicated by the color of stripe.
Connective features is the dashed arcs linking two beads, representing the chromatin loops . Delta displays intra-region (visual field) loops, i.e. the loops connecting to the beads out of current visual field will be omitted. This setting can help users focus on the selected partners in a clear vision. The arcs can be highlighted using mouse click with "shift" key down. Highlighting an arc will refresh the conjunct genome/circlet browser (see below). This is rather useful when comparing the two connected loci with multiple epigenetic features.
4.3 Dual View Mode
To enter the dual-mode, users can click on the check box named "Enter Dual-mode" in the 3D physical view page. Once entering into entered the dual-mode, the data displayed in the conjunctive genome or topological view is always synchronized with the physical view. For example, if you select a part of the physical model by drawing mouse left key with "Alt" key down, the synchronized genome or topological view will zoom into the region automatically. When one highlight an object in the physical view, e.g. a bead or an arc, the corresponding region will also be highlighted in the conjunctive view immediately.
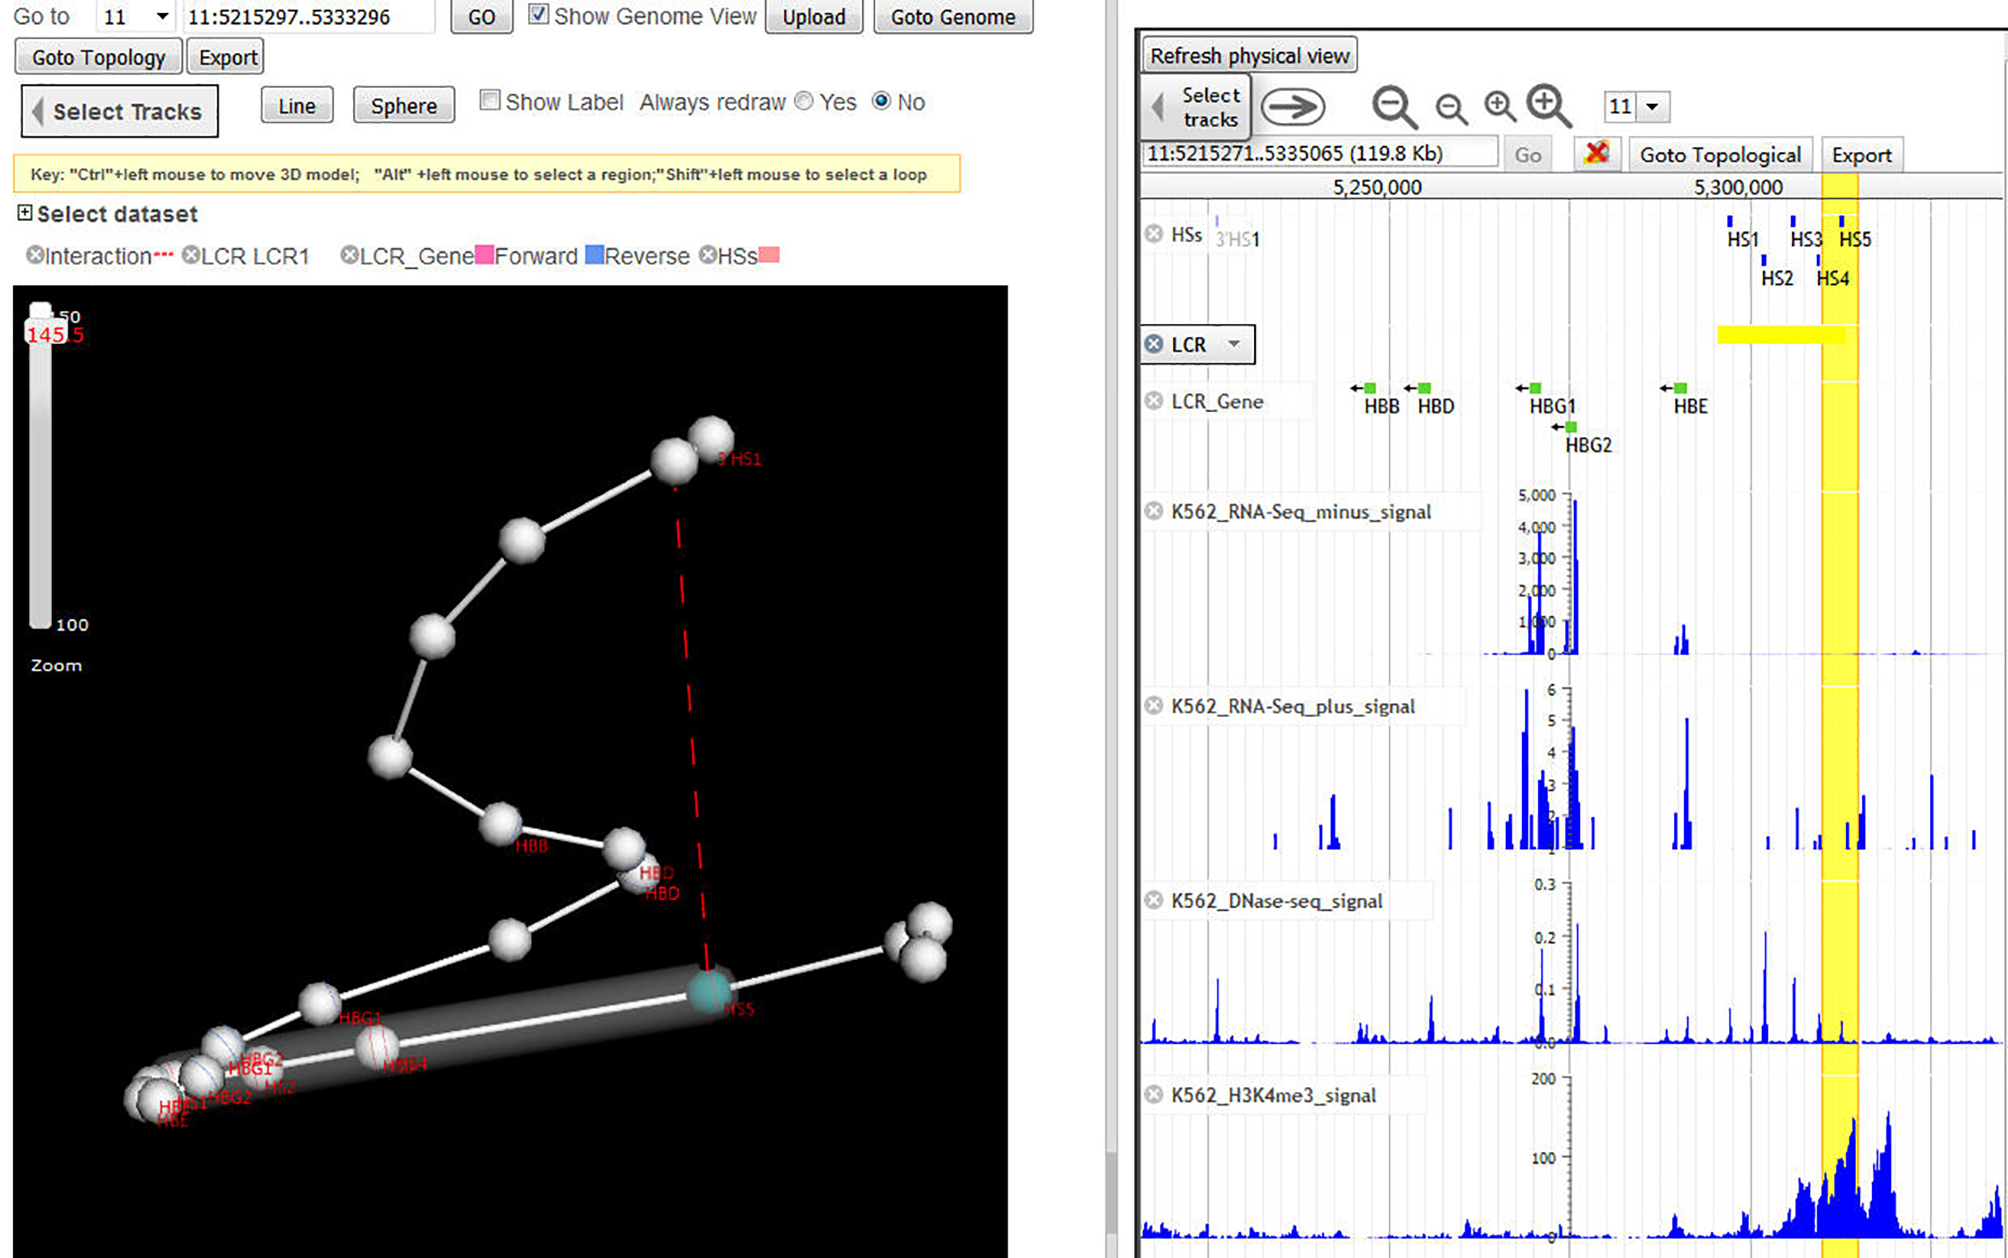
Physical View & Topological View
Click "Goto topological" button from genome view in dual-mode with physical view, a topological view will be displayed as follows.
Physical View & Topological View
Click "Goto topological" button from genome view in dual-mode with physical view, a topological view will be displayed as follows.
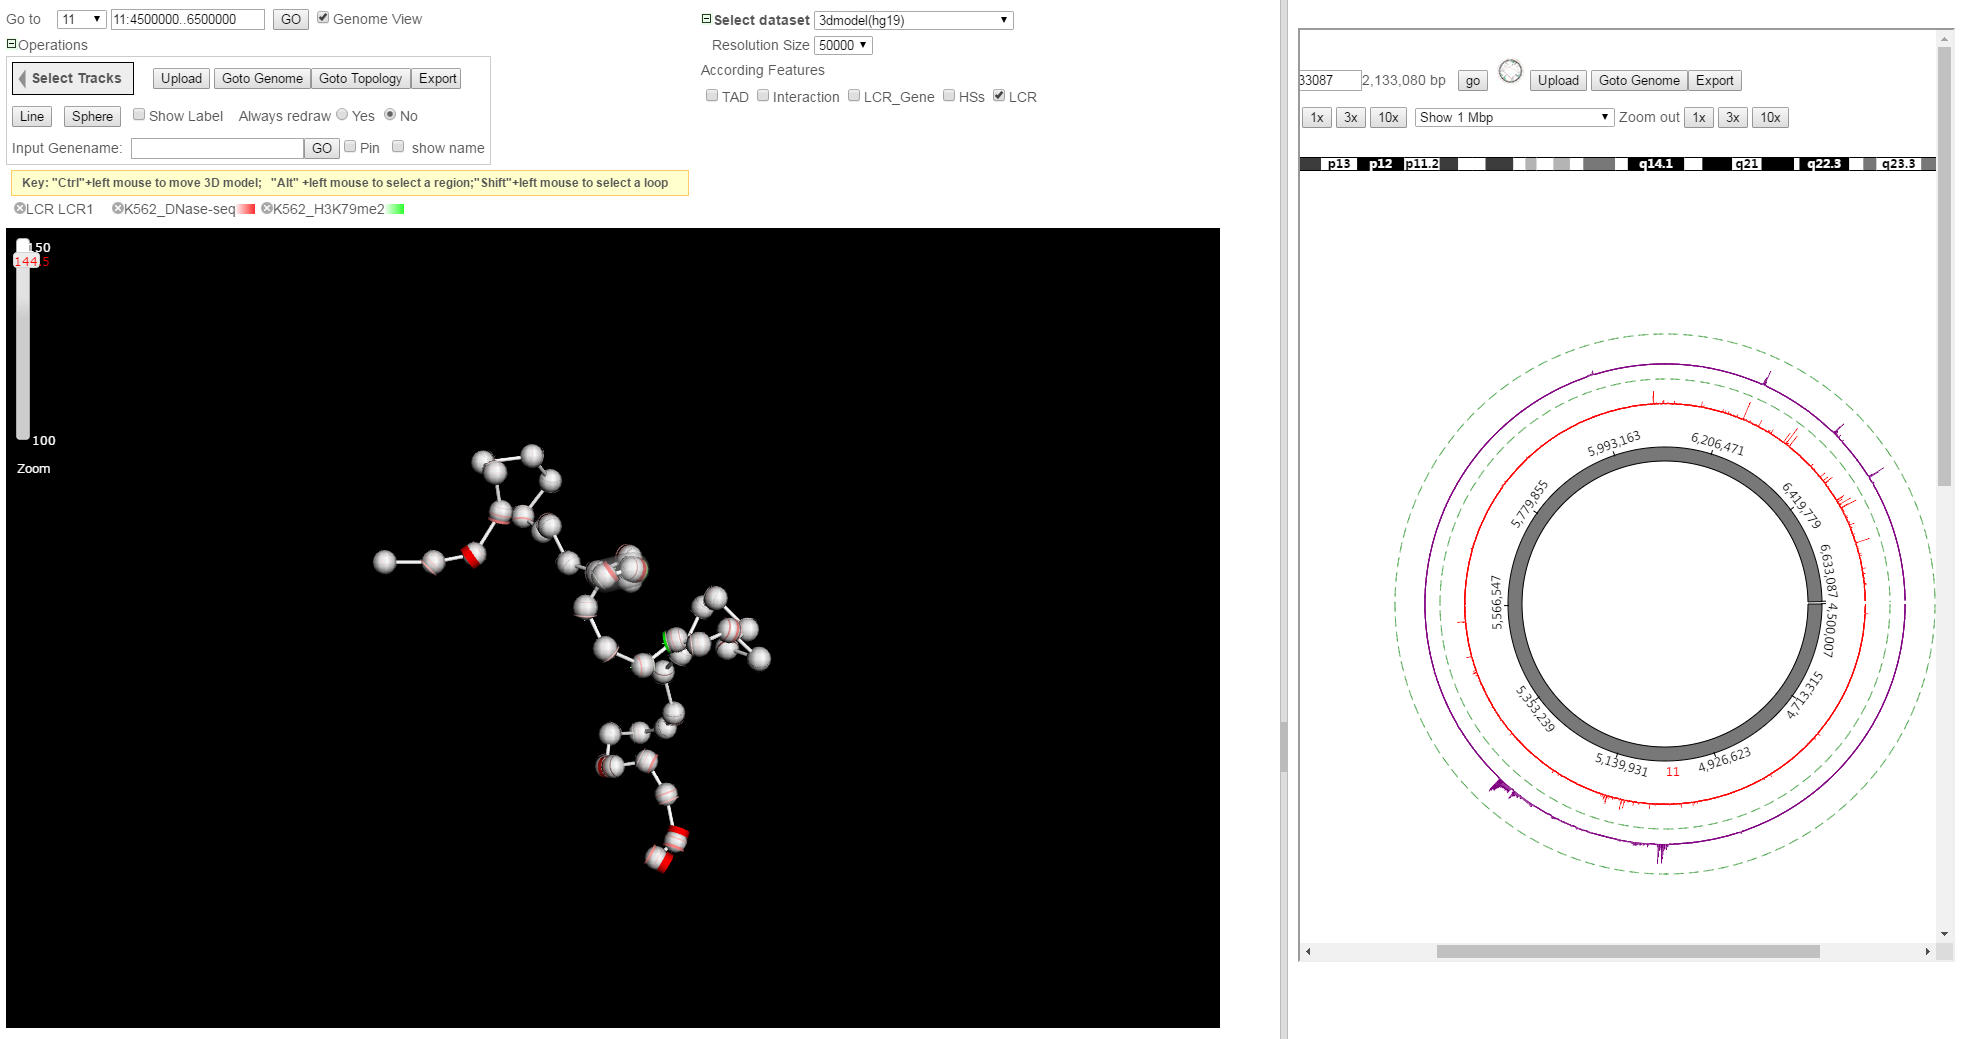
4.5 Jumping to Genome View and Topological View
Users can click the "Goto Genome" or "Goto Topological" button to go to the Genome View or Physical View respectively.